linux iostat syntax and iostat examples
linux iostat command is an abbreviation for I/O statistics (input/output statistics).
Iostat is a computer system monitor tool used to collect and show operating system storage input and output statistics.
Syntax
iostat [options] [interval] [count]interval: The interval parameter specifies the amount of time in seconds between each report. The count parameter can be specified in conjunction with the interval parameter.
count: If the count parameter is specified, the value of count determines the number of reports generated at interval seconds apart. If the interval parameter is specified without the count parameter, the iostat command generates reports continuously.
Common options
- -c
Display the CPU utilization report. - -d
Display the device utilization report. - -k
Display statistics in kilobytes per second. - -m
Display statistics in megabytes per second. - -N
Display the registered device mapper names for any device mapper devices. Useful for viewing LVM2 statistics. - -o JSON
Display the statistics in JSON (Javascript Object Notation) format. JSON output field order is undefined, and new fields may be added in the future. - -x
Display extended statistics. - -t
Print the time for each report displayed.
Reports
The iostat command generates two types of reports, the CPU Utilization report and the Device Utilization report.
CPU Utilization Report:
- %user
Show the percentage of CPU utilization that occurred while executing at the user level. - %nice
Show the percentage of CPU utilization that occurred while executing at the user level with nice priority. - %system
Show the percentage of CPU utilization that occurred while executing at the system level (kernel). - %iowait
Show the percentage of time that the CPU or CPUs were idle during which the system had an outstanding disk I/O request. - %steal
Show the percentage of time spent in involuntary wait by the virtual CPU or CPUs while the hypervisor was servicing another virtual processor. - %idle
Show the percentage of time that the CPU or CPUs were idle and the system did not have an outstanding disk I/O request.
Device Utilization Report:
- tps
Indicate the number of transfers per second that were issued to the device. - Blk_read/s (kB_read/s, MB_read/s)
Indicate the amount of data read from the device expressed in a number of blocks (kilobytes, megabytes) per second. - Blk_wrtn/s (kB_wrtn/s, MB_wrtn/s)
Indicate the amount of data written to the device expressed in a number of blocks (kilobytes, megabytes) per second. - Blk_read (kB_read, MB_read)
The total number of blocks (kilobytes, megabytes) read. - Blk_wrtn (kB_wrtn, MB_wrtn)
The total number of blocks (kilobytes, megabytes) written.
- Device
This column gives the device (or partition) name as listed in the /dev directory. - r/s
The number (after merges) of read requests completed per second for the device. - w/s
The number (after merges) of write requests completed per second for the device. - sec/s (kB/s, MB/s)
The number of sectors (kilobytes, megabytes) read from or written to the device per second. - rsec/s (rkB/s, rMB/s)
The number of sectors (kilobytes, megabytes) read from the device per second. - wsec/s (wkB/s, wMB/s)
The number of sectors (kilobytes, megabytes) written to the device per second. - %util
Percentage of elapsed time during which I/O requests were issued to the device (bandwidth utilization for the device).
Remarks
If %util is close to 100%, it means that there are too many I/O requests, the I/O system is full, and the disk may have a bottleneck.
Examples
Reports of all cpu and devices are displayed 3 times every 2 seconds.
$ iostat 2 3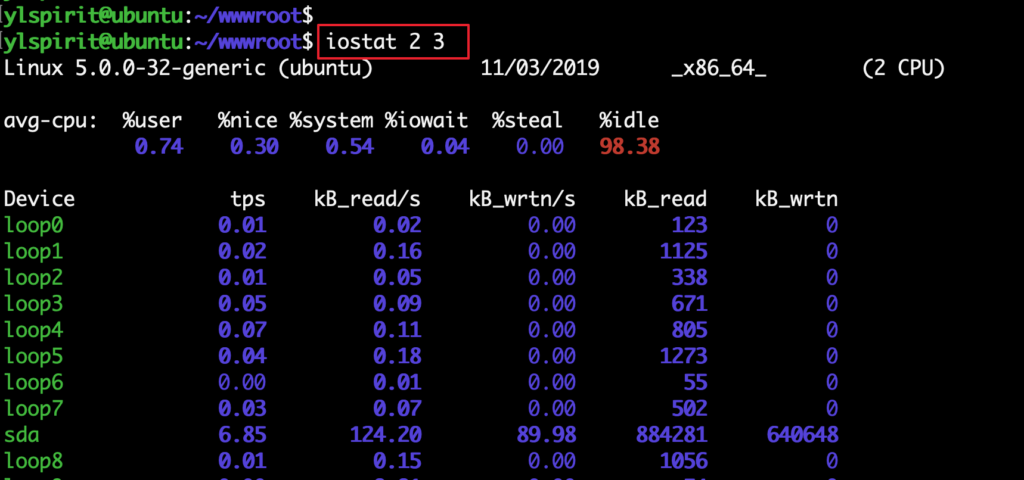
Display a continuous cpu report at two second intervals.
$ iostat -c 2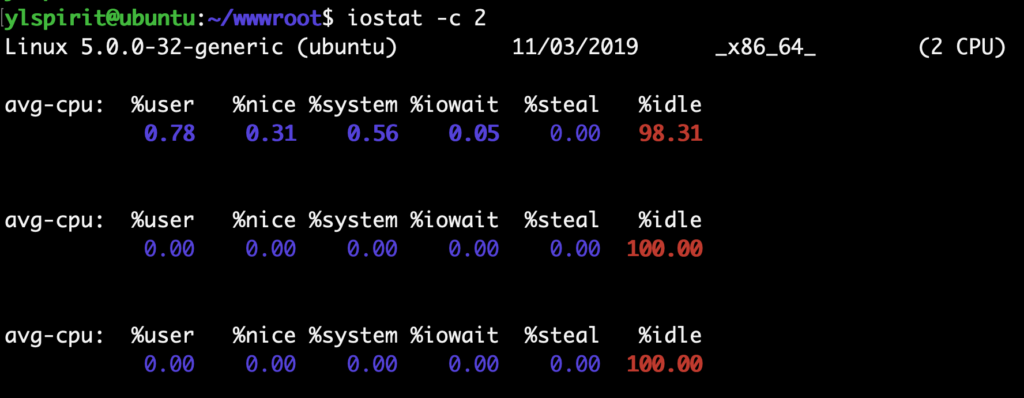
View bandwidth utilization for the device (%util) and response time (await)
$ iostat -d -k -x 1 1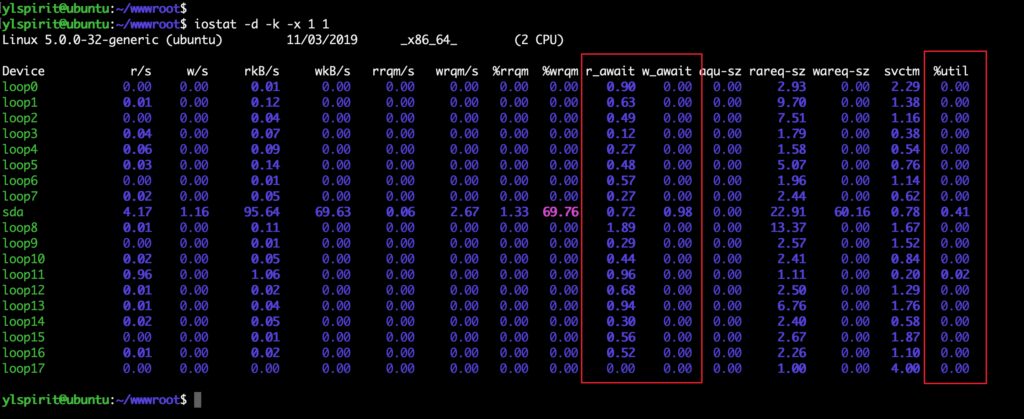
View TPS and throughput
$ iostat -d -k 1 1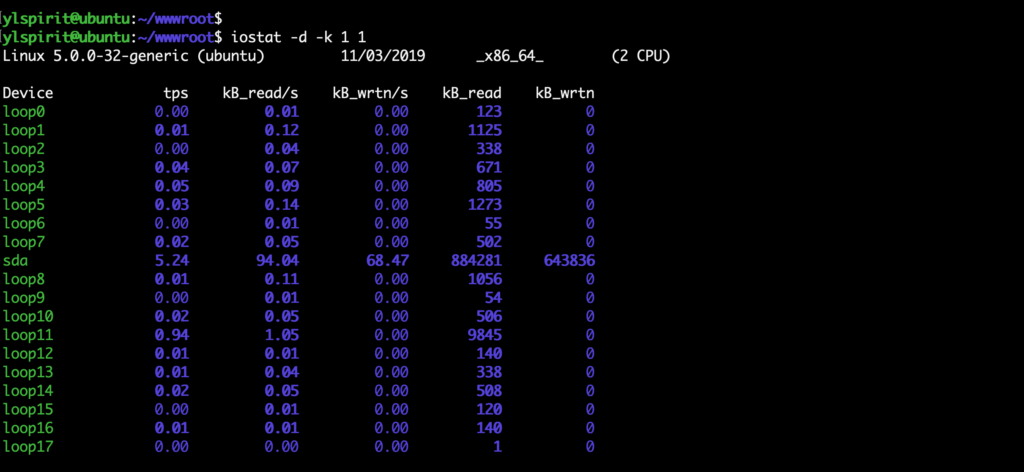
reference
About the use of the iostat command: Linux load average high
More about Linux commands: Linux Commands Tutorial