htop – linux/unix monitoring tool usage example
htop is an interactive system-monitor process-viewer and process-manager.
htop shows a frequently updated list of the processes running on a computer, normally ordered by the amount of CPU usage. Unlike top, htop provides a full list of processes running, instead of the top resource-consuming processes.
htop uses color and gives visual information about processor, swap and memory status. htop can also display the processes as a tree.
Below, we will introduce how to install htop on mac, htop can display what information, how to use htop.
mac install htop monitoring tool
We use brew package management tool on mac to install htop monitoring tool.
➜  ~ brew search htop
==> Formulae
htop
...

➜  ~ brew install htop
htop syntax
htop [-dChustv]htop options
- -d –delay=DELAY
Delay between updates, in tenths of seconds - -C –no-color –no-colour
Start htop in monochrome mode - -h –help
Display a help message and exit - -p –pid=PID,PID…
Show only the given PIDs - -s –sort-key COLUMN
Sort by this column (use –sort-key help for a column list) - -u –user=USERNAME
Show only the processes of a given user - -v –version
Output version information and exit - -t –tree
Show processes in tree view
htop operation interface
The same as the top process monitoring command, htop also opens a real-time monitoring interface. Enter the htop command directly to open the interface shown in the following figure:

In the picture above, the interface is divided into four areas:
Upper left area 1:
Displays information about CPU, physical memory, and swap partition.
Upper right area 2:
Displays information such as number of tasks, average load and connection running time.
Process area 3:
Show all processes in the current system.
Operation prompt area 4:
Displays the shortcut functions defined in the F1 – F10 function keys in the current interface.
htop interactive commands
F1 – Go to the help screen

F2 – Go to the setup screen

F3 – Incrementally search the command lines of all the displayed processes
F4 – Incremental process filtering: type in part of a process command line and only processes whose names match will be shown.
F5 – Tree view: organize processes by parenthood, and layout the relations between them as a tree.
F6 – On sorted view, select a field for sorting, also accessible through < and >.
Htop F6 interactive commands can be sorted by PID, USER, CPU, MEM, etc

F7 – Increase the selected process’s priority (subtract from ‘nice’ value).
F8 – Decrease the selected process’s priority (add to ‘nice’ value)
F9 – “Kill” process: sends a signal which is selected in a menu, to one or a group of processes.
F10 – Quit
Space – Tag or untag a process. Commands that can operate on multiple processes, like “kill”, will then apply over the list of tagged processes, instead of the currently highlighted one.
U – Untag all processes (remove all tags added with the Space key).
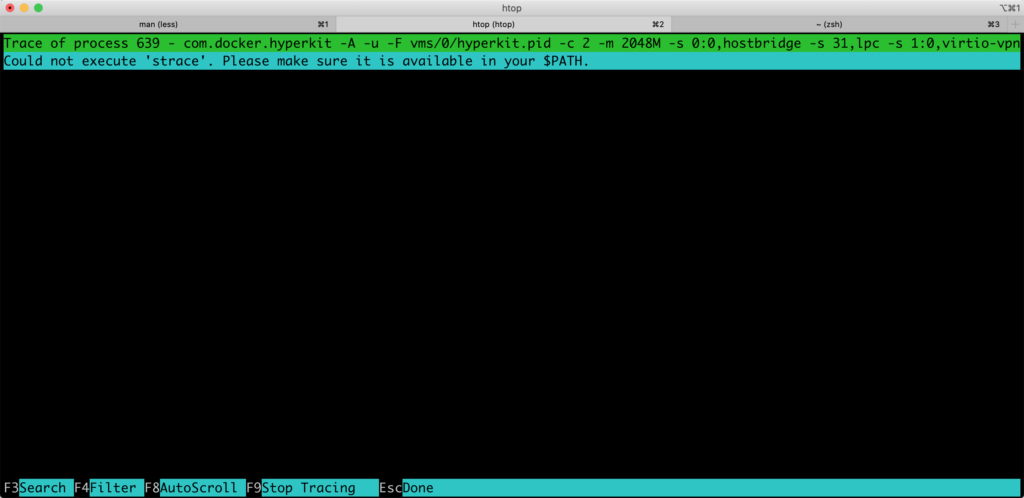
s – Trace process system calls: if strace(1) is installed, pressing this key will attach it to the currently selected process, presenting a live update of system calls issued by the process.
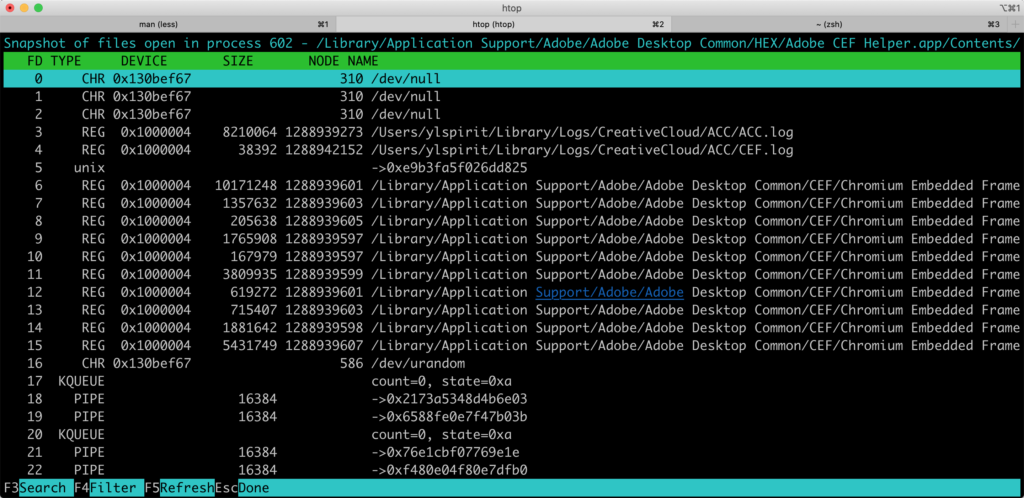
l – Display open files for a process: if lsof(1) is installed, pressing this key will display the list of file descriptors opened by the process.